Monday, December 3, 2018

Productivity stack for 2019


Apparently some people seem to think my level of productivity is simply not humanly possible: 


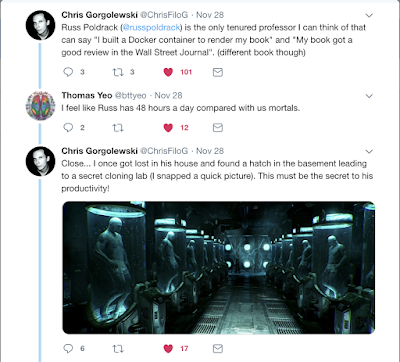
For the record, there is no cloning lab in my basement.  I attribute my productivity largely to a combination of mild obsessive/compulsive tendencies and a solid set of tools that help me keep from feeling overwhelmed when the to-do list gets too long.  I can’t tell you how to become optimally obsessive, but I can tell you about my productivity stack, which I hope will be helpful for some of you who are feeling increasingly overwhelmed as you gain responsibilities. 

Platform: MacBook Pro 13” + Mac OS X 
  • I have flirted with leaving the Mac as the OS has gotten increasingly annoying and the hardware increasingly crappy, but my month-long trial period with a Windows machine left me running back to the Mac (mostly because the trackpad behavior on the Dell XPS13 was so bad).  Despite the terrible keyboard (I’ve had two of them replaced so far) and the lack of a physical escape key, the 13” Macbook Pro is a very good machine for working on the road - it’s really light and the battery life is good enough that I rarely have to plug in, even on a long flight from SFO to the east coast.  In the old days I would invert my screen colors to reduce power usage, but now I just use Dark Mode in the latest Mac OSX.
  • I keep a hot spare laptop (a previous-generation Macbook Pro) synced to all of my file sharing platforms (Dropbox, Box, and Google Drive) in case my primary machine were to die suddenly.  Which has happened. And will happen again. If you can afford to have a second laptop I would strongly suggest keeping a hot spare in the wings.
  • I don’t have a separate desktop system in my office - when I’m there I just plug into a larger monitor and work from my laptop. In the past I had separate desktop and laptop systems but just found it too easy for things to get desynchronized.
  • Pro Tip: About once a month I run the Onyx maintenance scripts, run the DiskUtility file system repair, and clone my entire system to a lightweight 1TB external drive (encrypted, of course) using CarbonCopyCloner.  Having a full disk backup in my backpack has saved me on a few occasions when things went wrong while traveling.

Mobile: Pixel 2 + Google Fi 
  • I left the iPhone more than a year ago now and have not looked back.  The Pixel 2 is great and Google Fi wireless service is awesome, particularly if you travel a lot internationally, since data costs the same almost everywhere on earth.  If you want to sign up, use my referral link and you’ll get a $20 credit (full disclosure - I will get a $100 credit).

Email: Gmail  
  • For many years I used the Mac Mail.app client, but as it became increasingly crappy I finally gave up and moved to the GMail web client, which has been great.  The segregation of promotion and social emails, and new features like nudges, make it a really awesome mail client.  
  • My email workflow is a lazy adaptation of the GTD system: I try not to leave anything in my inbox for more than a day or so (unless I’m traveling).  I either act on it immediately, decide to ignore/delete it, or put it straight into my todo list (and archive the message so it’s no longer in my inbox).  I’m rarely at inbox zero, but I usually manage to keep it at 25 or fewer messages, so I can see it all in a single screen.

To do list: Todoist 
  • I moved to Todoist a couple of years ago and have been very happy with it. It’s as simple as it needs to be, and no simpler.  The integration with GMail is particularly nice.
Calendar: Google Calendar
  • The integration between my Android device and Gmail across platforms makes this a no-brainer.


Notes: Evernote 
  • Evernote is my go-to for note-taking during meetings, talks, and whenever I just want to write something down.  

Lab messaging: Slack 
  • I really don’t love Slack (because I feel that it’s too easy for things to get lost when a channel is busy), but it has become our lab’s main platform for messaging.   We've tried alternatives but they have never really stuck.

Safe Surfing: Private Internet Access VPN + UBlock Origin/Privacy Badger 
  • Whenever I’m on a public network I stay safe by using the Private Internet Access VPN, which works really well across every platform I have tested it.   (and you can pay for it with Bitcoin!)
  • When surfing in Chrome I use UBlock Origin and Privacy Badger extensions to prevent trackers. 

Writing: Google Docs/TexShop 
  • For collaborative writing we generally stick to Google Docs, which just works.  Paperpile is a very effective reference management system.  
  • For my own longer projects (like books) I write in LaTeX using TexShop, with BibDesk for bibliography management, via the MacTex distribution.  If I were writing a dissertation today I would definitely use LaTeX, as I have seen too many students scramble as Microsoft Word screwed up their huge dissertation file.  Some folks in the lab use Overleaf, which I like, but I also do a lot of writing while offline so a web-based solution isn’t optimal for me.

Presentations: Keynote 
  • I have tried at various points to leave Keynote, but always came crawling back.  It’s just so easy to create great-looking presentations, and as cool as it would be to build them in LaTeX, I would have nightmares involving the inability to compile my presentation 3 minutes before my talk.

Art: Affinity Designer 
  • I gave up on Adobe products when they moved to a subscription model.  For vector art, I really like Affinity Designer, though it does have a pretty substantial learning curve.  I've tried various freeware alternatives but none of them work very well.

Coding in R: Rstudio 
  • If you’ve read my statistics book you know that I have a love/hate relationship with R, and most of the love comes from RStudio, which is an excellent IDE.  Except for code meant to run on the supercomputer, I write nearly all of my R code in RMarkdown Notebooks, which are the best solution for literate programming that I have seen.

Coding in Python: Anaconda + Jupyter Lab/Atom 
  • Python is my language of choice for most coding problems, and Anaconda has pretty much everything I need for scientific Python.
  • For interactive coding (e.g. for teaching or exploration) I use Jupyter Lab, which has matured nicely.  
  • For non-interactive coding (e.g. for code that will run on the supercomputer) I generally use Atom which is nice and simple but gets the job done.

Hopefully these tips are helpful - now back to getting some real work done! 

Tuesday, November 27, 2018

Automated web site generation using Bookdown, CircleCI, and Github

For my new open statistics book (Statistical Thinking for the 21st Century), I used Bookdown which is a great tool for writing a book using RMarkdown.  However, as the book came together, the time to build the book grew to more than 10 mins due to the many simulations and Bayesian model estimation.  And since each output type (of which there are currently three: Gitbook, PDF, and EPUB) requires a separate build run, rebuilding the full book distribution became quite an undertaking.  For this reason, I decided to implement an automated solution using the CircleCI continuous integration service. We already use this service for many of the software development projects in our lab (such as fMRIPrep and  MRIQC), so it was a natural choice for this project as well.

The use of CircleCI for this project is made particularly easy by the fact that both the book source and the web site for the book are hosted on Github — the ability to set up hooks between Github and CircleCI allows two important features. First, it allows us to automatically trigger a rebuild of the site whenever there is a new push to the source repo.  Second, it allows CircleCI to push a new copy of the book files to the separate repo that the site is served from.

Here are the steps to setting this up - see the Makefile and CircleCI config.yml file in the repo for questions.  And if you come across anything that I missed please leave a comment below!

  1. Create a CircleCI account linked to the relevant GitHub account.
  2. Add the source repo to CircleCI.
  3. Create the CircleCI config.yml file.  Here is the content of my config file, with comments added to explain each step:

version: 2
jobs:
  build:
    docker:
# this is my custom Docker image
      - image: poldrack/statsthinking21

CircleCI spins up a VM specified by a Docker image, to which we can then add any necessary additional software pieces.  I initially started with an image with R and the tidyverse preinstalled (https://hub.docker.com/r/rocker/tidyverse/) but installing all of the R packages as well as the TeX distribution needed to compile the PDF took a very long time, quickly using up the 1,000 build minutes per month that come with the CircleCI free plan.  In order to save this time I build a custom Docker container (Dockerfile) that incorporates all of the dependencies needed to build the book; this way, CircleCI can simply pull the container from my DockerHub repo and run it straight away rather than having to build a bunch of R packages.   

    steps:
      - add_ssh_keys:
          fingerprints:
            - "73:90:5e:75:b6:2c:3c:a3:46:51:4a:09:ac:d9:84:0f”

In order to be able to push to a github repo, CircleCI needs a way to authenticate itself.  A relatively easy way to do this is to generate an SSH key and install the public key portion as a “deploy key” on the Github repo, then install the private key as an SSH key on CircleCI.  I had problems with this until I realized that it requires a very specific type of SSH key (a PEM key using RSA encryption), which I generated on my Mac using the following command:

ssh-keygen -m PEM -t rsa -C "poldrack@gmail.com


# check out the repo to the VM - it also becomes the working directory
      - checkout
# I forgot to install ssh in the docker image, so install it here as we will need it for the github push below
      - run: apt-get install -y ssh
# now run all of the rendering commands
      - run:
           name: rendering pdf
           command: |
             make render-pdf
      - run:
           name: rendering epub
           command: |
             make render-epub
      - run:
           name: rendering gitbook
           command: |
             make render-gitbook

The Makefile in the source repo contains the commands to render the book in each of the three formats that we distribute: Gitbook, PDF, and EPUB.  Here we build each of those.

# push the rendered site files to its repo on github
      - run:
           name: check out site repo
           command: |
             cd /tmp
             ssh-keyscan github.com >> ~/.ssh/known_hosts

The ssh-keyscan command is necessary in order to allow headless operation of the ssh command necessary to access github below.  Otherwise the git clone command will sit and wait at the host authentication prompt for a keypress that will never come.

# clone the site repo into a separate directory
             git clone git@github.com:psych10/thinkstats.git
             cd thinkstats
# copy all of the site files into the site repo directory
             cp -r ~/project/_book/* .
             git add .
# necessary config to push
             git config --global user.email poldrack@gmail.com             git config --global user.name "Russ Poldrack"
             git commit -m"automated update"
             git push origin master

That’s it! CircleCI should now build and deploy the book any time there is a new push to the repo.  Don’t forget to add a CircleCI badge to the README to show off your work!   

Tuesday, November 20, 2018

Statistical Thinking for the 21st Century - a new intro statistics book

I have published an online draft of my new introductory statistics book, titled "Statistical Thinking for the 21st Century", at http://thinkstats.org.  This book was written for my undergraduate statistics course at Stanford, which I started teaching last year.  The first time around I used Andy Field's An Adventure in Statistics, which I really like but most of my students disliked because the statistical content was buried within a lot of story.  In addition, there are a number of topics (overfitting, cross-validation, reproducibility) that I wanted to cover in the course but weren't covered deeply in the book.  So I decided to write my own, basically transcribing my lecture slides into a set of RMarkdown notebooks and generating a book using Bookdown.

There are certainly many claims in the book that are debatable, and almost certainly things that I have gotten wrong as well, given that I Am Not A Statistician.  If you have the time and energy, I'd love to hear your thoughts/suggestions/corrections - either by emailing me, or by posting issues at the github repo. 

I am currently looking into options for publishing this book in low-cost paper form - if you would be interested in using such a book for a course you teach, please let me know.  Either way, the electronic version will remain freely available online.


Tuesday, April 17, 2018

How can one do reproducible science with limited resources?

When I visit other universities to talk, we often end up having free-form discussions about reproducibility at some point during the visit.  During a recent such discussion, one of the students raised a question that regularly comes up in various guises. Imagine you are a graduate student who desperately wants to do fMRI research, but your mentor doesn’t have a large grant to support your study.  You cobble together funds to collect a dataset of 20 subjects performing your new cognitive task, and you wish to identify the whole-brain activity pattern associated with the task. Then you happen to read "Scanning the Horizon” which points out that a study with only 20 subjects is not even sufficiently powered to find the activation expected from a coarse comparison of motor activity to rest, much less to find the subtle signature of a complex cognitive process.  What are you to do?
In these discussions, I often make a point that is statistically correct but personally painful to our hypothetical student:  The likelihood of such a study identifying a true positive result if it exists is very low, and the likelihood of any positive results being false is high (as outlined by Button et al, 2013), even if the study was fully pre-registered and there is no p-hacking.  In the language of clinical trials, this study is futile, in the sense that it is highly unlikely to achieve its aims. In fact, such a study is arguably unethical, since the (however miniscule) risks of participating in the study are not offset by any potential benefit to the subject or to society.  This raises a dilemma: How are students with limited access to research funding supposed to gain experience in an expensive area of research and test their ideas against nature?

I have struggled with how to answer these questions over the last few years.  I certainly wouldn't want to suggest that only students from well-funded labs or institutions should be able to do the science that they want to do.  But at the same time, giving students a pass on futile studies will have dangerous influence, since many of those studies will be submitted for publication and will thus increase the number of false reports (positive or negative) in the literature.  As Tal Yarkoni said in his outstanding “Big Correlations in Little Studies” paper:
Consistently running studies that are closer to 0% power than to 80% power is a sure way to ensure a perpetual state of mixed findings and replication failures.
Thus, I don’t think that the answer is to say that it’s OK to run underpowered studies.  In thinking about this issue, I’ve come up with a few possible ways to address the challenge.

1) "if you can’t answer the question you love, love the question you can"

In an outstanding reflection published last year in the Journal of Neuroscience, Nancy Kanwisher said the following in the context of her early work on face perception:
I had never worked on face perception because I considered it to be a special case, less important than the general case of object perception. But I needed to stop messing around and discover something, so I cultivated an interest in faces. To paraphrase Stephen Stills, if you can’t answer the question you love, love the question you can.
In the case of fMRI, one way to find a question that you can answer is to look at shared datasets.  There is now a huge variety of shared data available from resources including OpenfMRI/OpenNeuro, FCP/INDI, ADNI, the Human Connectome Project, and OASIS, just to name a few. If  a relevant dataset is not available openly but you know of a paper where someone has reported such a dataset, you can also contact those authors and ask whether they would be willing to share their data (often with an agreement of coauthorship). An example of this from our lab is a recent paper by Mac Shine (published in Network Neuroscience), in which he contacted the authors of two separate papers with relevant datasets and asked them to share the data. Both agreed, and the results came together into a nice package.  These were pharmacological fMRI studies that would not have even been possible within my lab, so the sharing of data really did open up a new horizon for us.

Another alternative is to do a meta-analysis, either based on data available from sites like Neurosynth or Neurovault, or by requesting data directly from researchers.  As an example, a student in one of my graduate classes did a final project in which he requested the data underlying meta-analyses published by two other groups, and then combined these to perform a composite meta-analysis, which was ultimately published.  

2) Focus on cognitive psychology and/or computational models for now

One of my laments regarding the training of cognitive neuroscientists in today’s climate is that their training is generally tilted much more strongly towards the neuroscience side (and particularly focused on neuroimaging methods), at the expense of training in good old fashioned cognitive psychology.  As should be clear from many of my writings, I think that a solid training in cognitive psychology is essential in order to do good cognitive neuroscience; certainly just as important as knowing how to properly analyze fMRI data. Increasingly, this means thinking about computational models for cognitive processes.  Spending your graduate years focusing on designing cognitive studies and building computational models of them will put you in an outstanding position to get a good postdoc in a neuroimaging lab that has the resources to support the kind of larger neuroimaging studies that are now required for reproducibility. I’ve had a couple of people from pure cognitive psychology backgrounds enter my lab as postdocs, and their NIH fellowship applications were both funded on the first try, because the case for additional training in neuroscience was so clear.  Once you become skilled at cognition and (especially) computation, imaging researchers will be chomping at the bit to work with you (I know I would!). In the meantime you can also start to develop chops at neuroimaging analysis using shared data as outlined in #1 above.

3) Team up

The field of genetics went through a similar reckoning with underpowered studies more than a decade ago, and the standard in that field is now for large genome-wide association studies which often include tens of thousands of subjects.  They also usually include tens of authors on each paper, because amassing such large samples requires more resources than any one lab can possess. This strategy has started to appear in neuroimaging through the ENIGMA consortium, which has brought together data from many different imaging labs to do imaging genetics analyses.  If there are other labs working on similar problems, see if you can team up with them to run a larger study; you will likely have to make compromises, but a reproducible study is worth it (cf. #1 above).

4) Think like a visual neuroscientist

This one won’t work for every question, but in some cases it’s possible to focus your investigation on a much smaller number of individuals who are characterized much more thoroughly; instead of collecting an hour of data each on 20 people, collect 4 hours of data per person on 5 people.  This is the standard approach in visual neuroscience, where studies will often have just a few subjects who have been studied in great detail, sometimes with many hours of scanning per individual (e.g. see any of the recent papers from Jack Gallant’s lab for examples of this strategy). Under this strategy you don’t use standard group statistics, but instead present the detailed results from each individual; if they are consistent enough across the individuals then this might be enough to convince reviewers, though the farther you get from basic sensory/motor systems (where the variance between individuals is expected to be relatively low) the harder it will be to convince them.  It is essential to keep in mind that this kind of analysis does not allow one to generalize beyond the sample of individuals who were included in the study, so any resulting papers will be necessarily limited in the conclusions they can draw.

5) Carpe noctem

At some imaging centers, the scanning rates become drastically lower during off hours, such that the funds that would buy 20 hours of scanning during prime time might stretch to buy 50 or more hours late at night.  A well known case is the Midnight Scan Club at Washington University, which famously used cheap late night scan time to characterize the brains of ten individuals in detail. Of course, scanning in the middle of the night raises all sorts of potential issues about sleepiness in the scanner (as well in the control room), so it shouldn’t be undertaken without thoroughly thinking through how to address those issues, but it has been a way that some labs have been able to stretch thin resources much further.  I don’t want this to be taken as a suggestion that students be forced to work both day and night; scanning into the wee hours should never be forced upon a student who doesn’t want to do it, and the rest of their work schedule should be reorganized so that they are not literally working day and night.

I hope these ideas are useful - If you have other ideas, please leave them in the comments section below!

(PS: Thanks to Pat Bissett and Chris Gorgolewski for helpful comments on a draft of this piece!)


Sunday, March 25, 2018

To Code or Not to Code (in intro statistics)?

Last week we wrapped Stats 60/Psych 10, which was the first time I have ever taught such a course.  One of the goals of the course was for the students to develop enough data analysis skill in R to be able to go off and do their own analyses, and it seems that we were fairly successful in this.  To quantify our performance I used data from an entrance survey (which asked about previous programming experience) and an exit survey (which asked about self-rated R skill on a 1-7 scale).  Here are the data from the exit survey, separated by whether the students had any previous programming experience:
This shows us that there are now about fifty Stanford undergrads who had never programmed before and who now feel that they have at least moderate R ability (3 or above).  Some comments on the survey question "What were your favorite aspects of the course?" also reflected this (these are all from people who had never programmed before):

  • The emphasis on learning R was valuable because I feel that I've gained an important skill that will be useful for the rest of my college career.
  • I feel like I learned a valuable skill on how to use R
  • Gradually learning and understanding coding syntax in R
  • Finally getting code right in R is a very rewarding feeling
  • Sense of accomplishment I got from understanding the R material on my own
At the same time, there was a substantial contingent of the class that did not like the coding component.  This was evident to some comments on the survey question "What were your least favorite aspects of the course?":
  • R coding. It is super difficult to learn as a person with very little coding background, and made this class feel like it was mostly about figuring out code rather than about absorbing and learning to apply statistics.
  • My feelings are torn on R. I understand that it's a useful skill & plan to continue learning it after the course (yay DataCamp), but I also found it extremely frustrating & wouldn't have sought it out to learn on my own.
  • I had never coded before, nor have I ever taken a statistics course. For me, trying to learn these concepts together was difficult. I felt like I went into office hours for help on coding, rather than statistical concepts.
One of the major challenges of the quarter system is that we only have 10 weeks to cover a substantial amount of material, which has left me asking myself whether it is worth it to teach students to analyze data in R, or whether I should instead use one of the newer open-source graphical statsitics packages, such as JASP or Jamovi.  The main pro that I see of moving to a graphical package are that the students could spend more time focusing on statistical concepts, and less time trying to understand R programming constructs like pipes and ggplot aesthetics that have little to do with statistics per se.   On the other hand, there are the several reasons that I decided to teach the course using R in the first place:
  • Many of the students in the class come from humanities departments where they would likely never have a chance to learn coding.  I consider computational literacy (including coding) to be essential for any student today (regardless of whether they are from sciences or the humanities), and this course provides those students with a chance to acquire at least a bit of skill and hopefully inspires curiosity to learn more.
  • Analyzing data by pointing and clicking is inherently non-reproducible, and one of the important aspects of the course was to focus the students on the importance of reproducible research practices (e.g. by having them submit RMarkdown notebooks for the problem sets and final project). 
  • A big part of working with real data is wrangling the data into a form where the statistics can actually be applied.  Without the ability to code, this becomes much more difficult.
  • The course focuses a lot on simulation and randomization, and I'm not sure that the interactive packages will be useful for instilling these concepts.
I'm interested to hear your thoughts about this tradeoff: Is it better for the students to walk away with some R skill but less conceptual statistical knowledge, or greater conceptual knowledge without the ability to implement it in code?  Please leave your thoughts in the comments below.

Monday, January 22, 2018

Defaults in R can make debugging incredibly hard for beginners

I am teaching a new undergraduate statistics class at Stanford, and an important part of the course is teaching students to run their own analyses using R/RStudio.  Most of the students have never coded before, and debugging turns out to be one of the major challenges. Working with students over the last few days I have found that a couple of the default features in R can combine to make debugging very difficult on occasion.  Changing these defaults could have a big impact on new users' early learning experiences.

One of the datasets that we use is the NHANES dataset via the NHANES library.  Over the last few days several students have experienced very strange problems, where the NHANES data frame doesn’t contain the appropriate data, even after restarting R and reloading the NHANES library.  It turns out that this is due to several “features” in R:
  • Users are asked when exiting whether to save the workspace image, and the default is to save it.
  • The global workspace (saved in ~/.RData) is by default automatically loaded upon starting R.
  • When a package is loaded that contains a data object, this object is masked by any object in the global workspace with the same name.  

Here is an example.  First I load the NHANES library, and check that the NHANES data frame contains the appropriate data.

> library(NHANES)
> head(NHANES)
     ID SurveyYr Gender Age AgeDecade AgeMonths Race1 Race3    Education MaritalStatus    HHIncome HHIncomeMid
1 51624  2009_10   male  34     30-39       409 White  <NA>  High School       Married 25000-34999       30000
2 51624  2009_10   male  34     30-39       409 White  <NA>  High School       Married 25000-34999       30000
3 51624  2009_10   male  34     30-39       409 White  <NA>  High School       Married 25000-34999       30000
4 51625  2009_10   male   4       0-9        49 Other  <NA>         <NA>          <NA> 20000-24999       22500
5 51630  2009_10 female  49     40-49       596 White  <NA> Some College   LivePartner 35000-44999       40000
6 51638  2009_10   male   9       0-9       115 White  <NA>         <NA>          <NA> 75000-99999       87500

Now let’s say that I accidentally set NHANES to some other value:

NHANES=NA
> NHANES
[1] NA

Now I quit RStudio, clicking the default “Save” option to save the workspace, and then restart RStudio. I get a message telling me that the workspace was loaded, and I see that my altered version of the NHANES variable still exists.  I would think that reloading the NHANES library should fix this, but this is what happens:

> library(NHANES)

Attaching package: ‘NHANES’

The following object is masked _by_ ‘.GlobalEnv’:

    NHANES

> NHANES
[1] NA

That is, objects in the global environment take precedence over newly loaded objects.  If one didn't know how to parse that warning they would have no idea that this loading operation is having no effect.  The only way rid ourselves of this broken variable is either restart R after removing ~/.RData, or remove the variable from the global workspace:

> rm(NHANES, envir = globalenv())
> library(NHANES)
> head(NHANES)
     ID SurveyYr Gender Age AgeDecade AgeMonths Race1 Race3    Education MaritalStatus    HHIncome HHIncomeMid
1 51624  2009_10   male  34     30-39       409 White  <NA>  High School       Married 25000-34999       30000
2 51624  2009_10   male  34     30-39       409 White  <NA>  High School       Married 25000-34999       30000
3 51624  2009_10   male  34     30-39       409 White  <NA>  High School       Married 25000-34999       30000
4 51625  2009_10   male   4       0-9        49 Other  <NA>         <NA>          <NA> 20000-24999       22500
5 51630  2009_10 female  49     40-49       596 White  <NA> Some College   LivePartner 35000-44999       40000
6 51638  2009_10   male   9       0-9       115 White  <NA>         <NA>          <NA> 75000-99999       87500

This seems like a combination of really problematic default behaviors to me: automatically saving and then loading the global workspace by default, and masking objects loaded from libraries with objects in the workspace.  Together they have resulted in hours of unnecessary confusion and frustration for my students, at exactly the point in their learning curve where it is most problematic to do so.

I have one simple suggestion for the R developers: Please turn off automatic loading of the workspace by default.  It would be as simple as changing the default on one radio box, and it would potentially save new users lots of time and frustration.

Until that happens, beginning R users should do the following:

  • Under the Preferences panel (the General Tab in R), unselect the “Restore .RData into workspace on startup” option.  
  • I would also recommend setting the “Save workspace to .RData on exit” preference to “Never”, since I find that I generally only restart R when I want the entire workspace cleared out, so this option will never be of use to me.